This blog reflects chart Analysis being done by me and some very good Finance, Economics and stock speculation Articles I come across.....
Showing posts with label Gold. Show all posts

Friday, July 9, 2010

Buy Gold Now or Wait for PullBack


With gold prices making new all-time highs, gold is getting lots of press. I’m frequently asked if people should be putting more gold into their portfolio.

I believe the answer is yes, but not yet.

Long term and from a fundamental perspective, it’s almost impossible to be anything but bullish on gold. With all the world’s central banks printing money as if it, well, grows on trees, the valuation of gold as a relatively scarce commodity has to go up. It’s only a matter of how long and how much.

In the shorter term and from the technical perspective, however, gold seems ripe for a pullback.

Most financial plans for overall portfolios would indicate that 5 – 10 percent of a person’s portfolio should be in gold or other hard assets. If you are building up to that level or have the belief that a higher percentage is right for you, then buying gold on pullbacks would be prudent.

Let’s take a look at why gold might be overextended in the short term.

Valuation in Terms Other Than Dollars

For many investors, valuing gold in dollars per ounce seems like a natural and universal way to look at the price of the precious metal. With currency fluctuations and other considerations, however, looking at gold in terms other than dollars can help us understand the value of gold relative to other investments. One of my favorite tools helps us see how many barrels of oil an ounce of gold will buy. We can see that ratio for the last eight years in the chart below.


As you can see in the chart above, gold is the top line and crude oil is in the middle of the graph. The lower line is the ratio of the two, or the number of barrels one ounce of gold will buy.

Over the past two years, this ratio has been extremely volatile, traveling well outside of its historical norms. As the chart shows, the low end of the range over the past decade has been just below 5 barrels per ounce of gold. The ratio peaked at 18 barrels per ounce at the height of the real estate/credit contraction crisis.

With this ratio hovering around 16 barrels per ounce now, we can see that gold remains relatively overbought. While this is not a definitive analysis, it does point to a gold price that is historically stretched to the upside.

From a technical viewpoint, we can see that gold formed a price pattern related to a triple top in the past week.

The triple top is pretty easy to see. And the momentum indicators—Chaikin Oscillator (one of my very favorites), MACD and RSI—all show growing divergence with each new peak. The upward trend line is also being tested.

If the price breaks this trend line, gold will most likely test the February low down in the $1050 range. If that level holds, the intermediate outlook (the next 3 – 6 months) will look very bullish.

Adding gold to portfolios as either an inflation hedge or a crisis hedge is most likely prudent for many investors and traders. Making those purchases at more savvy market points will help you add at more reasonable prices than when the entire crowd is jumping on board.

What to do About Gold

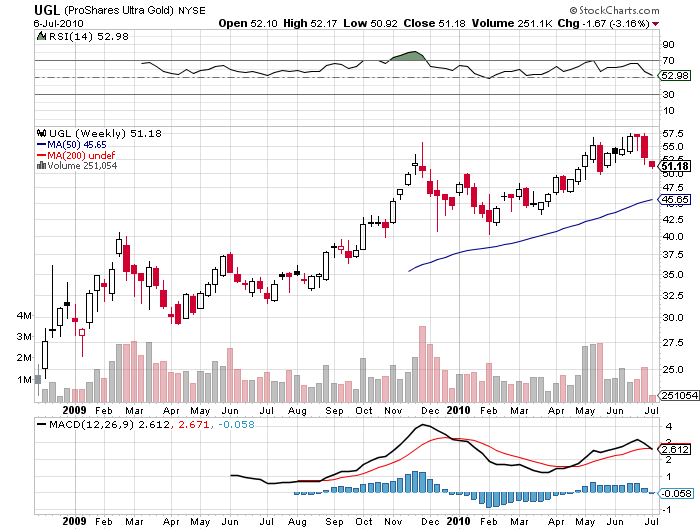
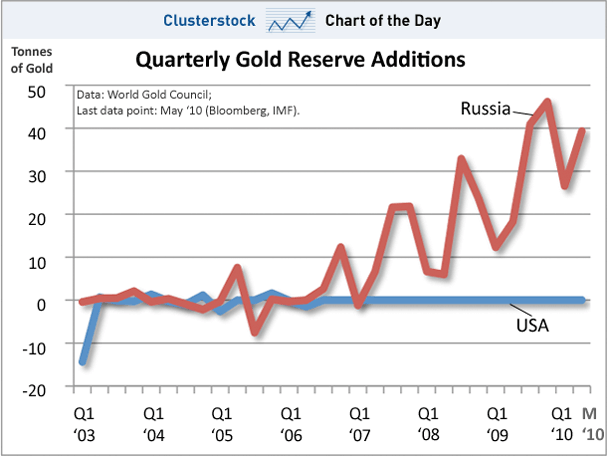
Gold, gold, gold. What to do about gold? I get asked this question a dozen times a day, by some who have been long since the current move started more than a decade ago at $260, and others who stood on the sidelines and watched in awe as it went to the moon, kicking themselves all the way. Is it too late to get in? They call the yellow metal the barbaric relic for a reason. Let’s face it. We’ve had a great run. Gold is one of the top performing assets of 2010 by a long shot, soaring 15% YTD to its peak last week, nearly topping the meteoric rise of the 30 year Treasury bond. Investors did even better in futures, leveraged ETF’s like the (UGL), and gold mining shares. Bulls are now facing the first test of their convictions in a year and a half, when it dipped to $680. At this stage, my inner trader makes me a short term bear. We may have reached an interim top, thanks to the aggressive purchases of emerging market central banks, as can be seen in the chart below of Russian purchases. Scrapping of old gold has reached all time highs. Have you seen all those ads offering to buy your old jewelry at a big discount? That’s where it’s coming from.

As summer begins, we are entering a traditional period of seasonal gold weakness. The Indian wedding season, the largest annual purchaser of the yellow metal, doesn’t start until the fall. If you are the world’s greatest day trader, and think you can grab something here on the short side, then go ahead and knock yourself out. But you will be going against the long term trend. Obama has not suddenly turned into a paragon of fiscal rectitude, and Ben Bernanke still has the keys to the printing presses. The Fed has yet to even admit its role in the credit bubble of the last decade. Fiat paper currencies are still running a frenzied race to the bottom.

Almost all short term money market alternatives globally are yielding close to zero, meaning that the opportunity cost of owning the barbaric relic is nil. They aren’t making gold any more. The output of gold has fallen by 12% annually for the past decade, compared to a doubling of production costs to $500/ounce. Reserves everywhere are playing out, and top producer Barrick Gold (ABX) isn’t opening a new mine at 15,000 feet in the Andes because it likes the fresh air. I still think my target of $2,300 is a chip shot, but it might take three years to get there. There are higher predictions of $5,000, $10,000, and $50,000 based on ratios of gold to broadening definitions of monetary assets, but I won’t bother with those. First things first.

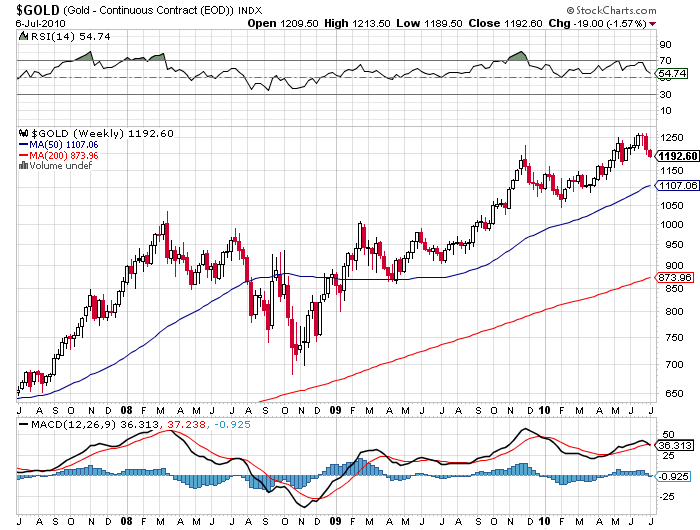
Below are the support points on the charts, with my comments.

$1,165 – Medium term trend support. Gold bounces here the first few times.
$1,107 -50 day moving average, probably holds, but a break signals a more serious pull back
$1,040 – low in the last down move, where the Reserve Bank of India last stepped in as a big buyer.
$873 – 200 day moving average. Bet the ranch. Very unlikely to get there, but the world is a big buyer if it does.
$680 – The 2008 low- Not a chance. We aren’t going to get a full blown flight to liquidity we saw in that dreadful year.

Use this dip to accumulate low cost, growing gold miners with decent valuations, which are enjoying escalating operating leverage the higher the barbaric relic runs. Some new names you might entertain are Royal Gold(RGLD), Agnico-Eagle Mines (AEM, TSX), and Great Basin Gold (GBG).